Searches
The purpose of this widget is to give you an overview of how many searches are performed at a given time interval, and a top list of the search queries performed in that period.
The resolution bar and core selection

Select the core for which you want statistics in the core selector at the bottom of the left menu. In the top of the widget you have the option to select time resolution. You can choose between daily, weekly, monthly and yearly resolution, and based on that selection, you can choose a specific day, week, month or year. You can specify a different resolution default under Admin -> Basic Setup -> “Default Resolution”.
By default, the statistcs shown is based on all handlers in the specified core. But you can also choose to see statitics for a specific handler by selecting a handler in the “Search handler”-dropdown.
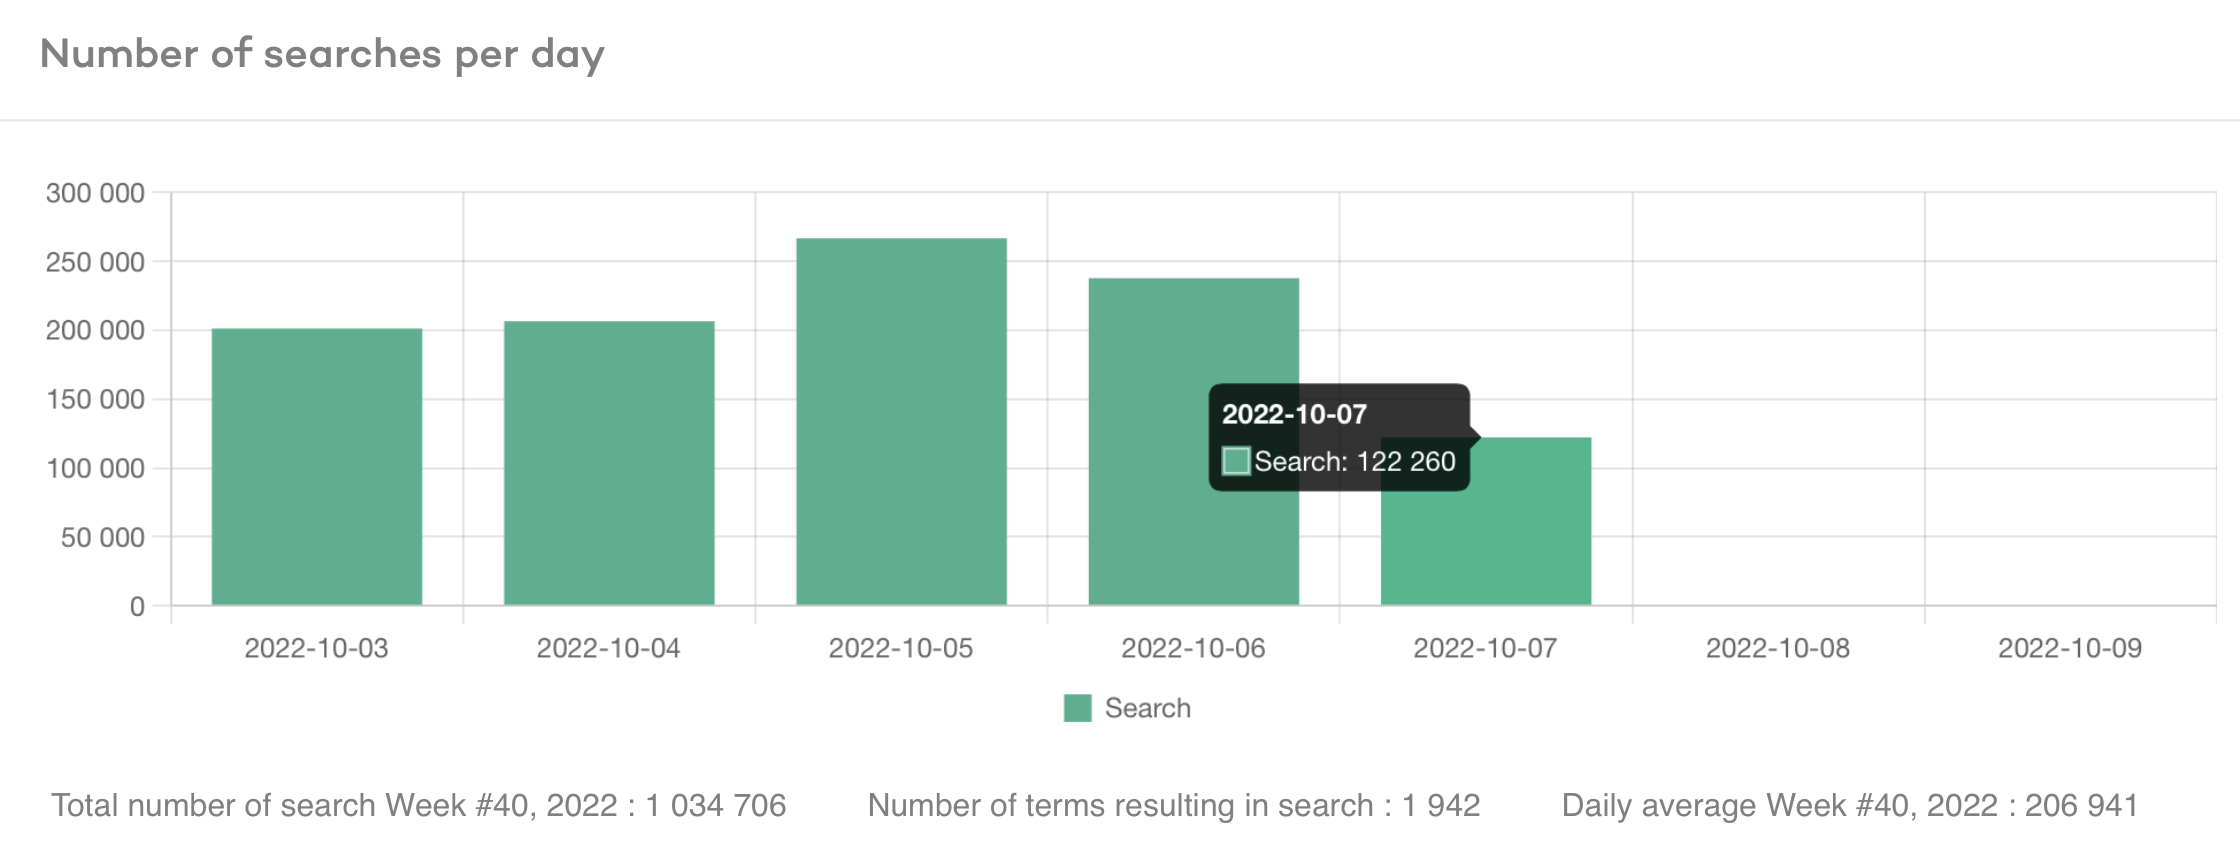
Number of searches per hour/day/week/month

This graph shows the total number of searches performed in a time period based on the selected resolution. If you hover over a bar in the graph, you will see the exact total for the selected bar.
This graph is updated every second minute and it is based on the default timezone specified in the GUI under Admin -> Basic Setup.
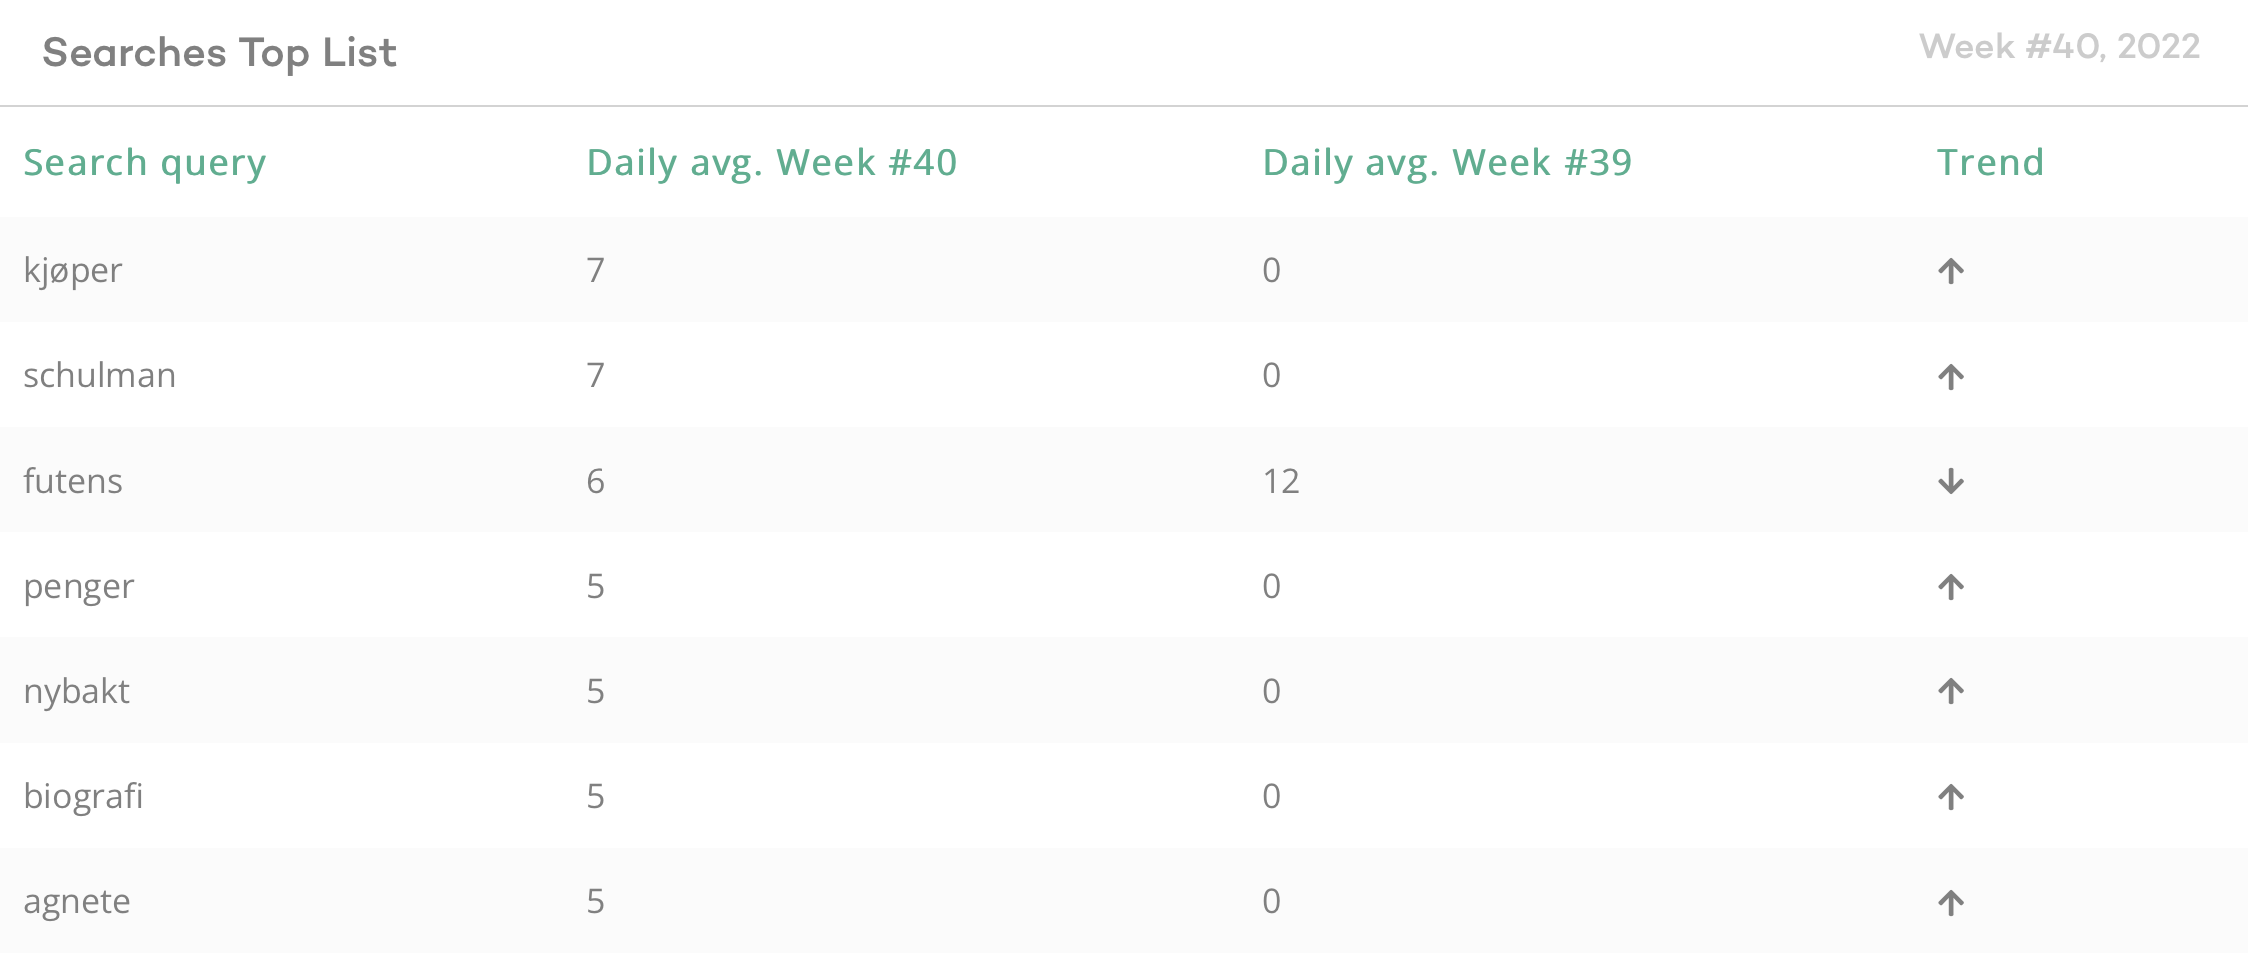
Searches Top List

This top list shows the most popular search queries used in the time period selected. The time at which the list is updated, depends on the selected resolution.
- Daily and weekly resolution: updated every hour at the 8th minute
- Monthly resolution: updated every day at the 00:15th minute
- Yearly resolution: updated every day at 00:30th minute
The times for updating the top list and the data itself is based on the UTC timezone.
If you click on a specific search query, you will open a new widget that will show you the statistics for that specific search query, and provide entry points for adding synonyms, elevation and boost.