Statistics
This page shows usage statistics for the whole deployment: LLM cost and token usage, and search
volume. Use the period picker in the upper right corner to choose a granularity: Daily,
Weekly, Monthly, Yearly or the default Last 30 days, a rolling window with no date to pick.
For the other four granularities, the arrows step one period at a time (a day, week, month or
year). Daily, Monthly and Yearly additionally let you jump straight to a period with the
calendar icon; Weekly does not, so a week is only reached by stepping the arrows to it.
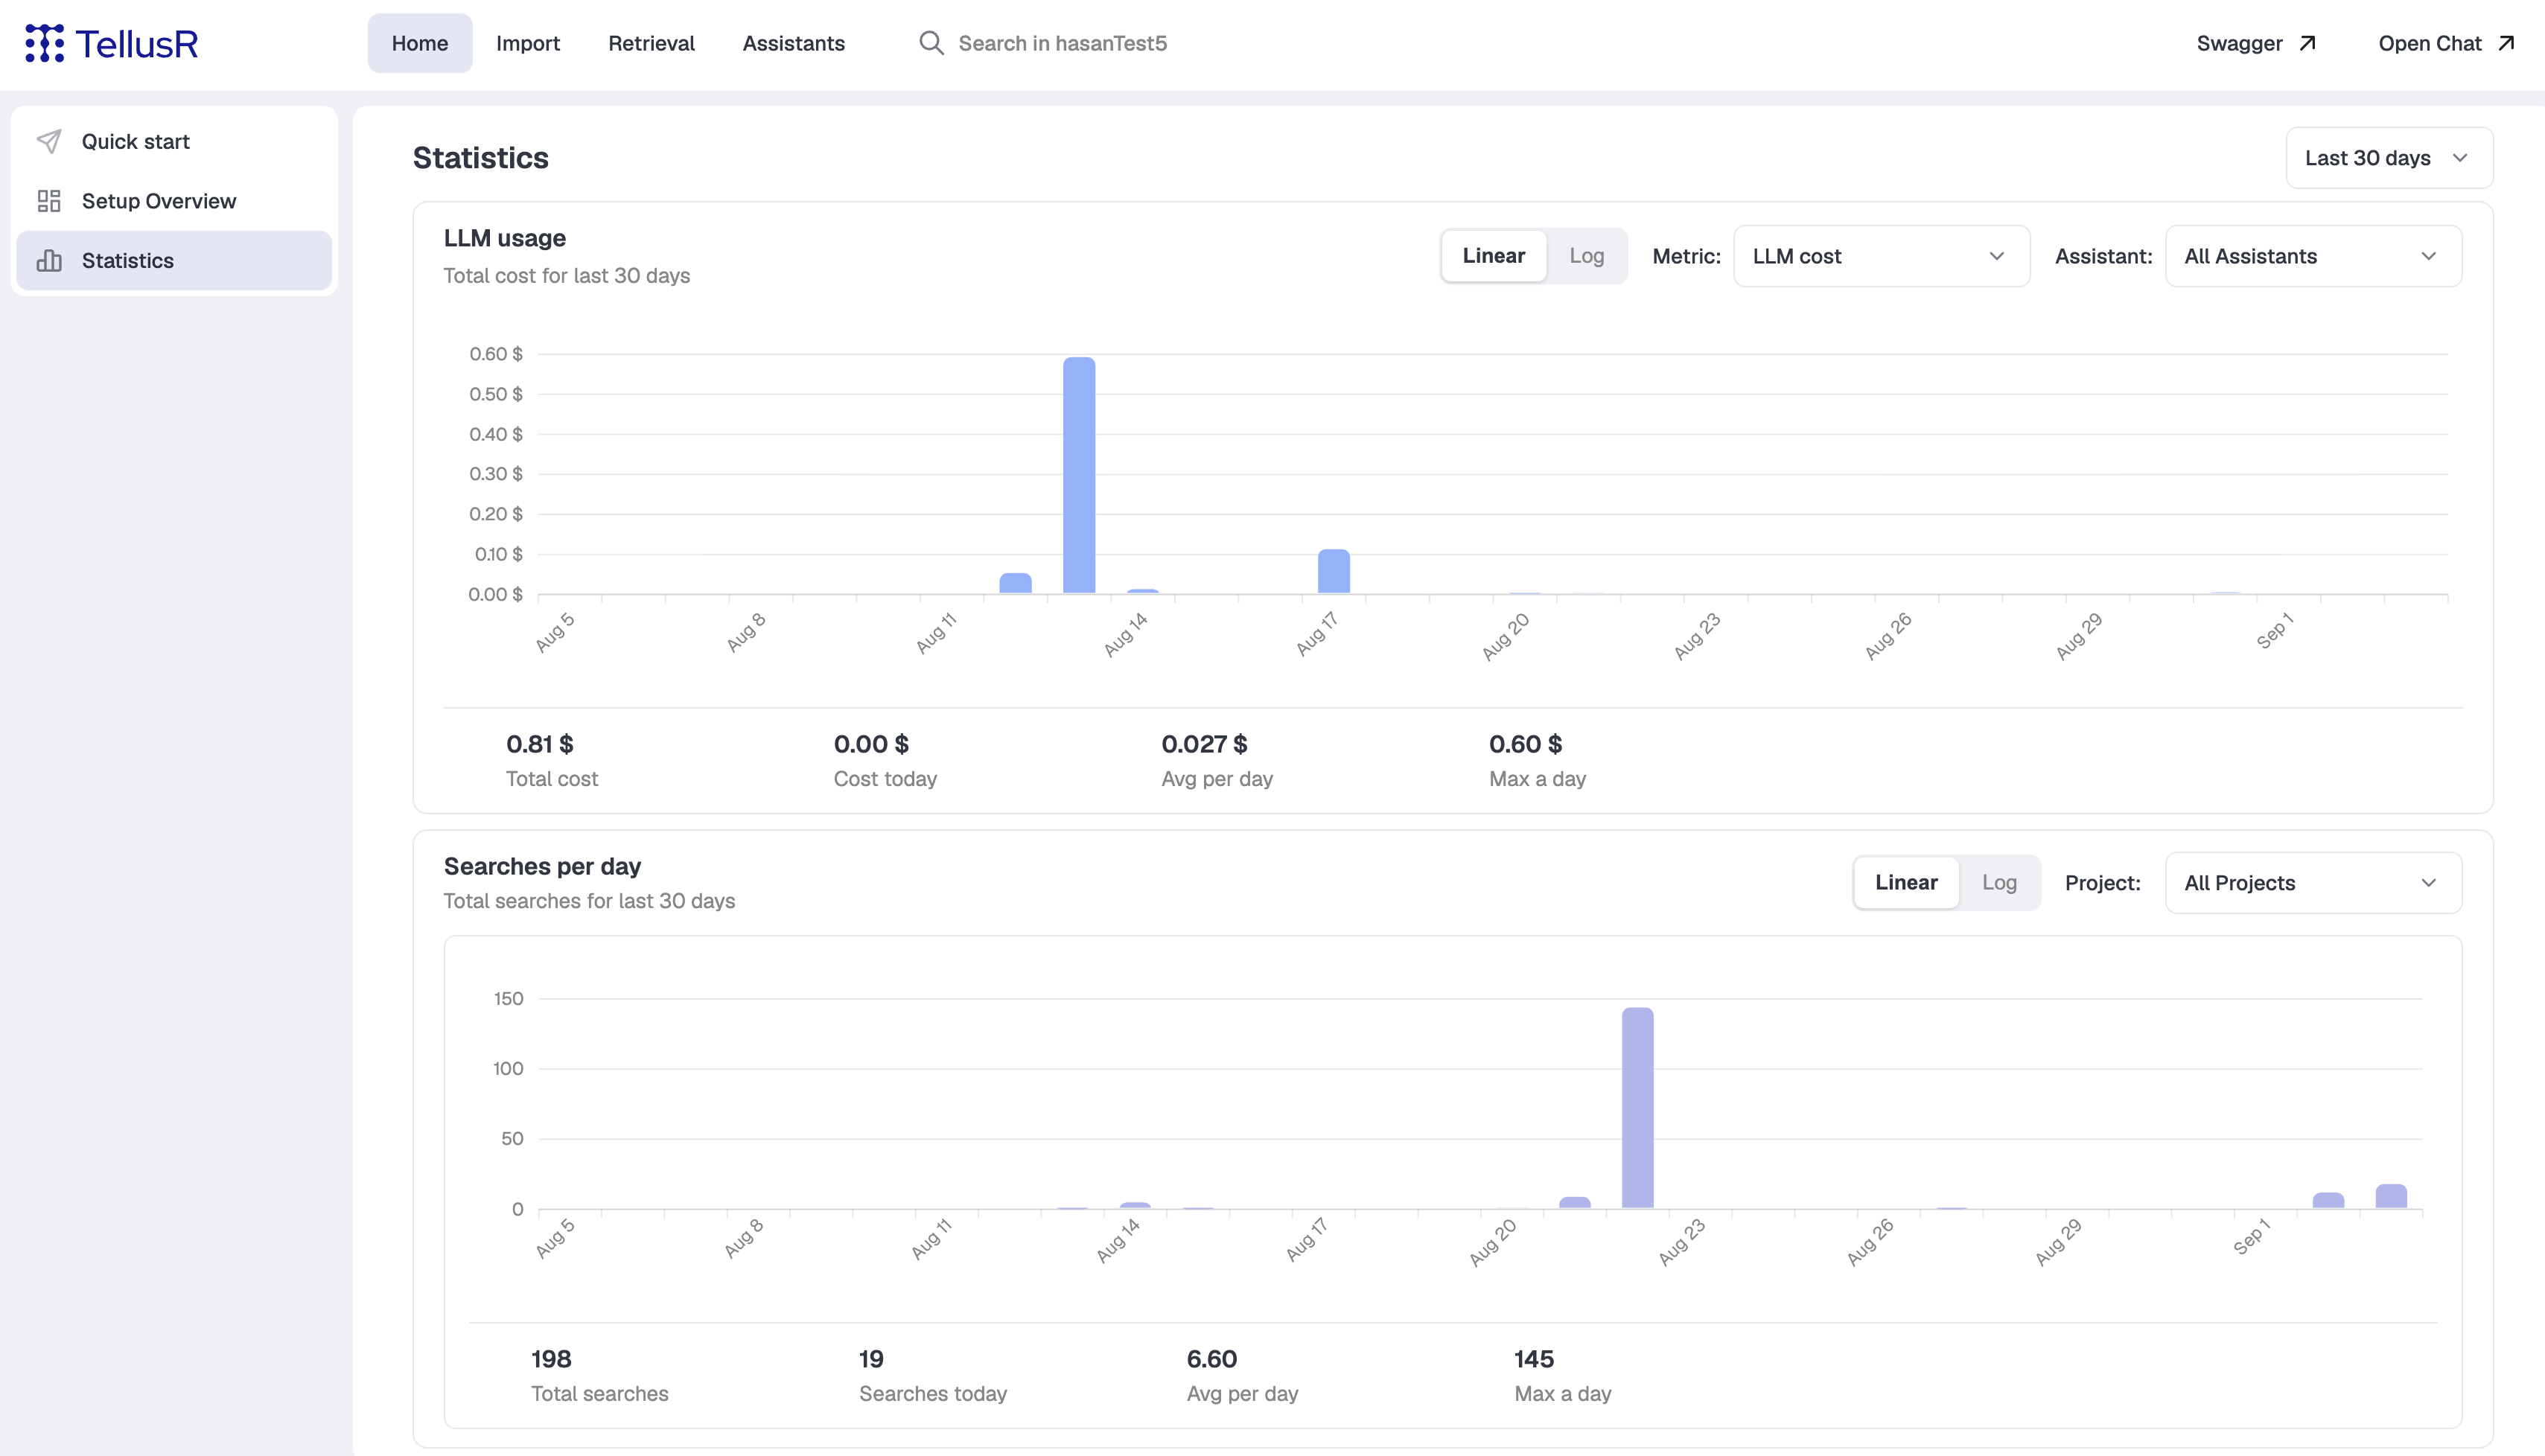
LLM usage
A bar chart of LLM usage over the selected period. Switch between and
scale, choose the Metric (LLM cost or Token usage), and filter by
Assistant (defaults to All Assistants, which sums every assistant).
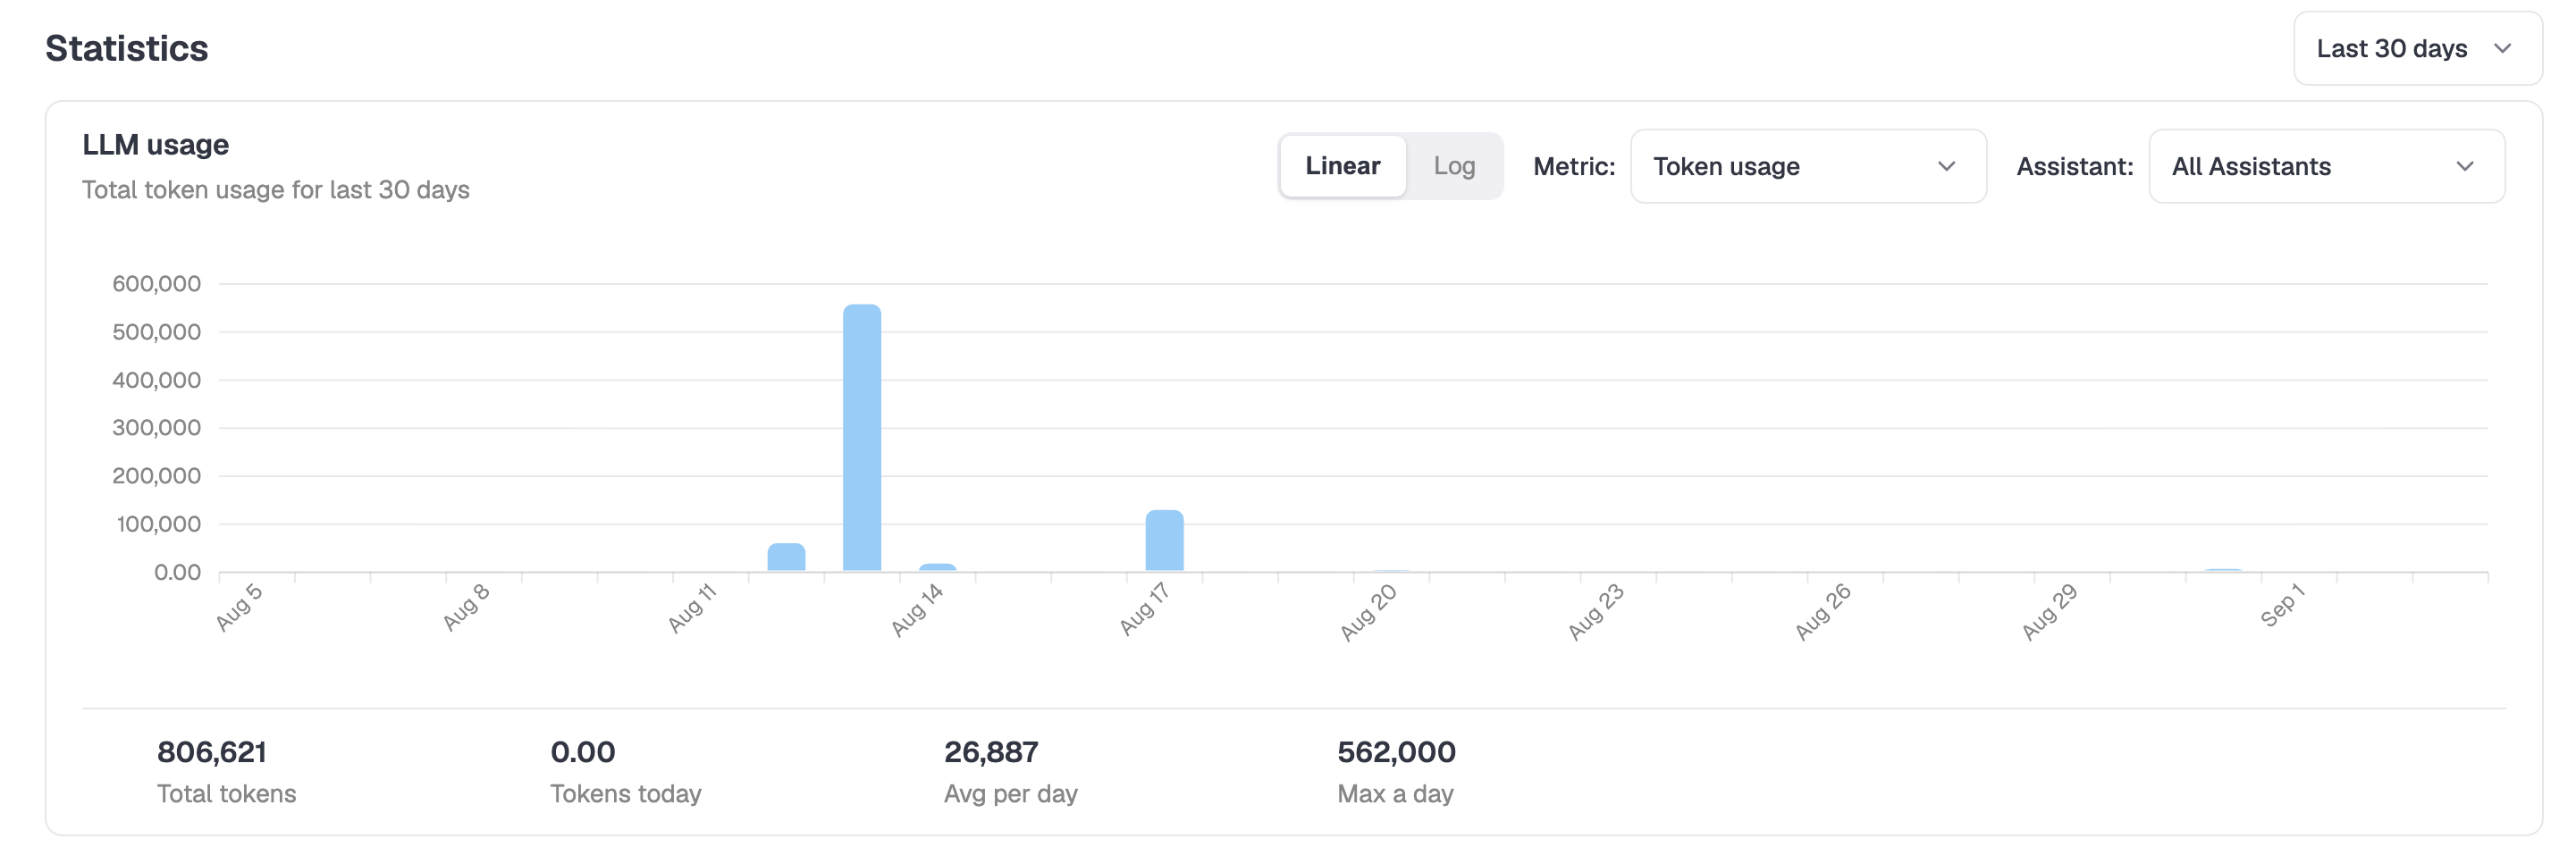
Below the chart, summary counters show the total for the period, the current bucket (e.g. cost
today), the average per bucket, and the maximum in a single bucket. The exact labels adapt to the
chosen granularity (for example Avg per hour on Daily).
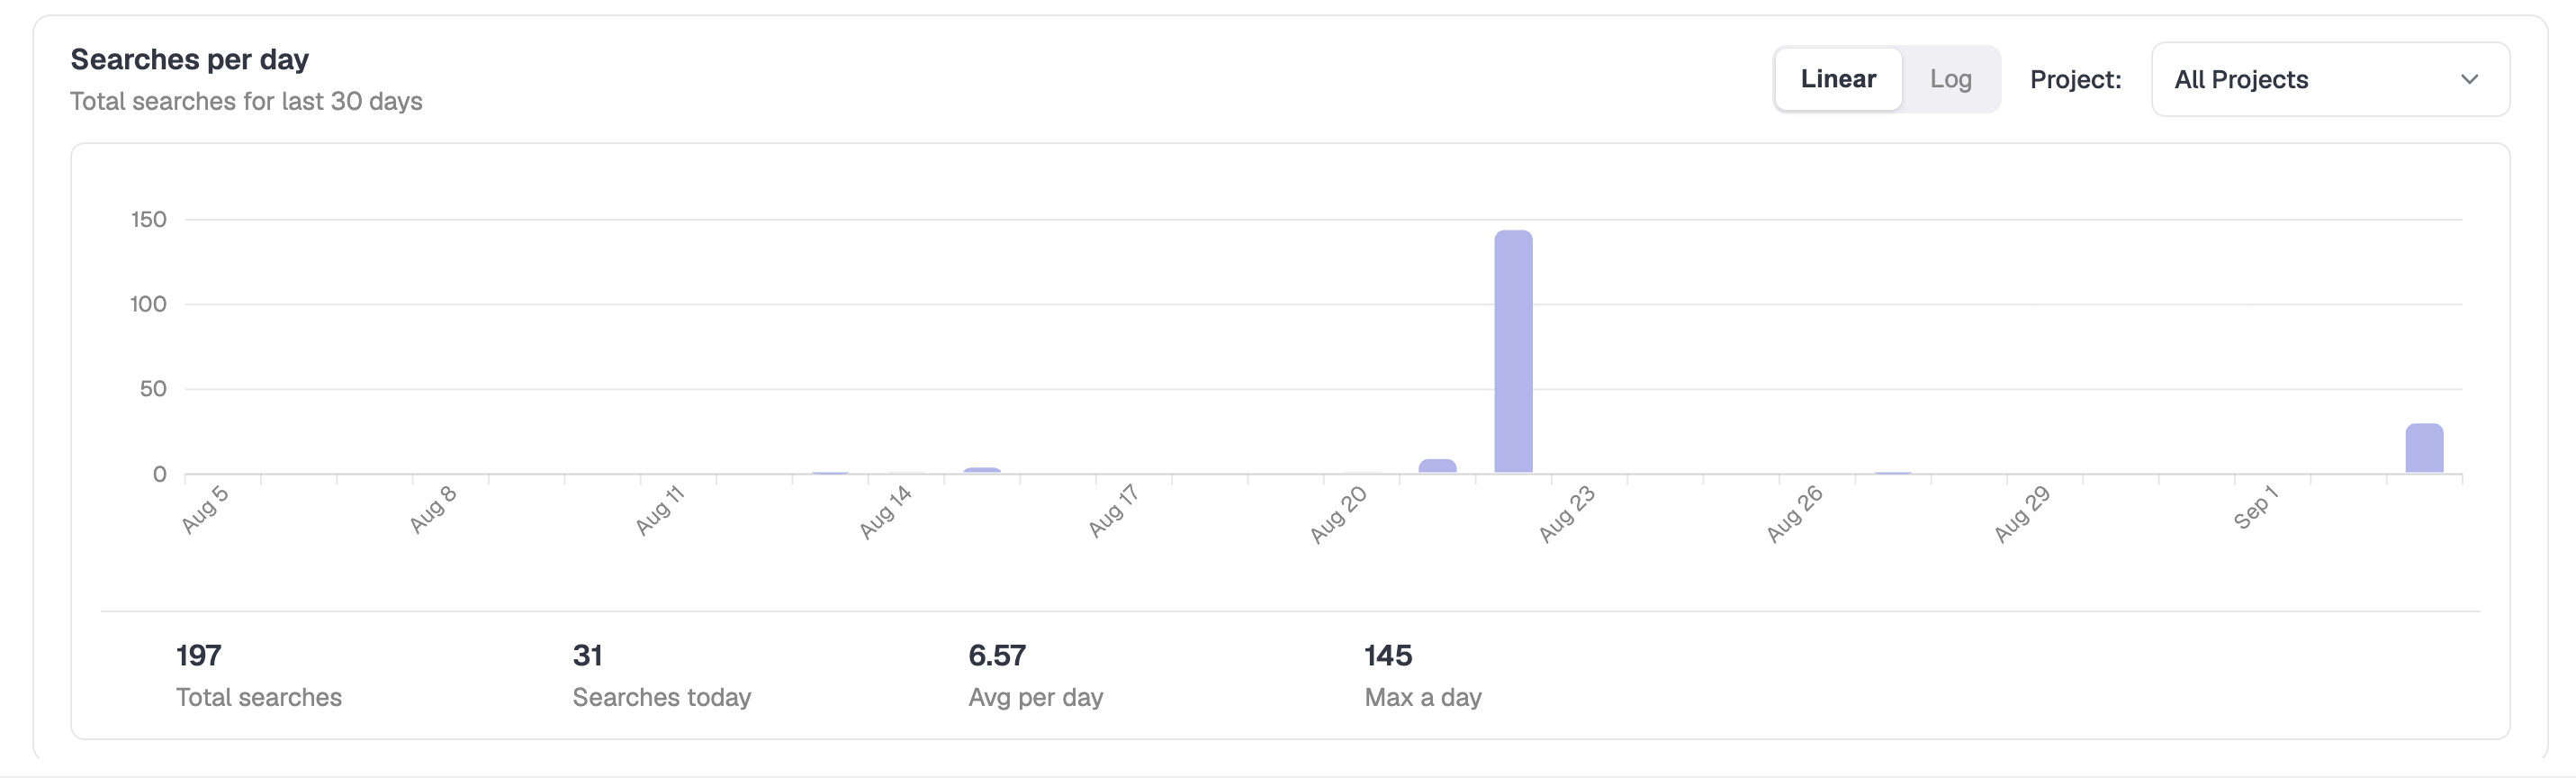
Searches per day
A bar chart of the number of searches performed, scoped to a Project (defaults to All Projects).
Switch between and scale. The same summary
counters as LLM usage are shown below: total, current period, average and maximum.