Statistics
This page shows statistics for files imported into the selected project. Use the dropdown in the upper right corner to select the time range (e.g. last 30 days).
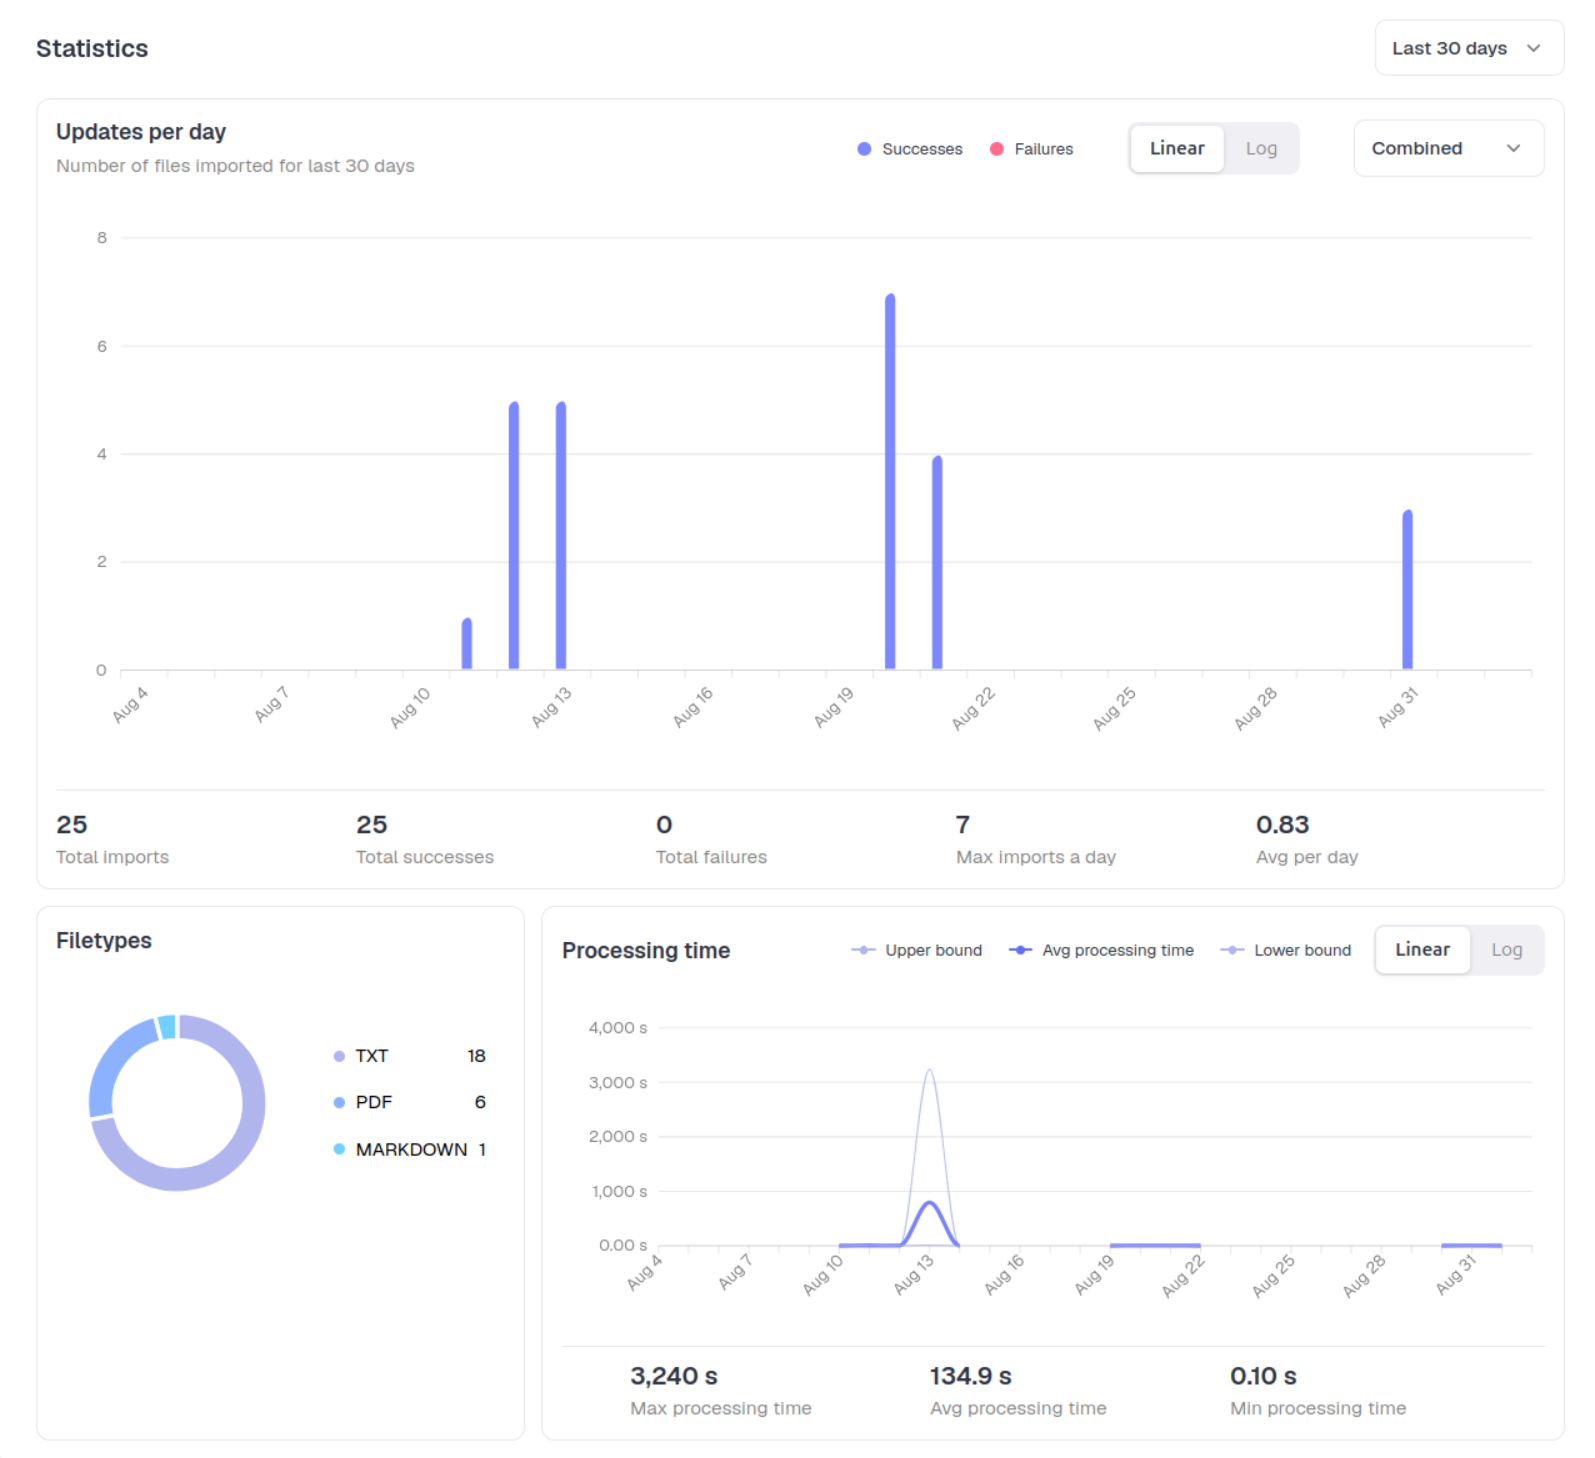
Updates per day
A bar chart of the number of files imported per day, split into successes and failures. Switch
between Linear and Log scale, and use the dropdown to view successes and failures combined or
separately.
Below the chart, summary counters show total imports, total successes, total failures, the maximum number of imports in a single day, and the average imports per day over the selected range.
Filetypes
A donut chart showing the breakdown of imported files by file type (e.g. TXT, PDF, Markdown).
Processing time
A chart of file processing time over the selected range, showing the average processing time as
well as its upper and lower bounds. Switch between Linear and Log scale.
Below the chart, summary counters show the maximum, average and minimum processing time over the selected range.